There is an example Notebook that Databricks publishes based on public Lending Tree loan data which is a loan risk analysis example. With analytics projects like this example, the common Data Engineering mantra states that up to 75% of the work required to bring successful analytics to the business is the data integration and data transformation work. So what I’m going to do here is to walk you through an example of how you would design an ADF Mapping Data Flow to filter, aggregate, and profile the data in the loans example.
In the sample from Databricks, they perform these Data Engineering tasks:
- Load the rows from a CSV file
- Map the columns in the rows to field names
- Filter for specific loan statuses
- Group by address state
- Aggregate by count of annual income
This will prepare the data for the loan risk machine learning model in Databricks. So, in migrating this example to visual data flows, I’ll use the CSV source data in Blob Store using an ADF Delimited Text dataset. I’ll keep the transformed data in Blob as a CSV using Delimited Text so that the modeling experts will be able to use it for their analysis.
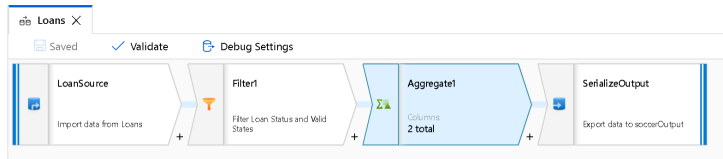
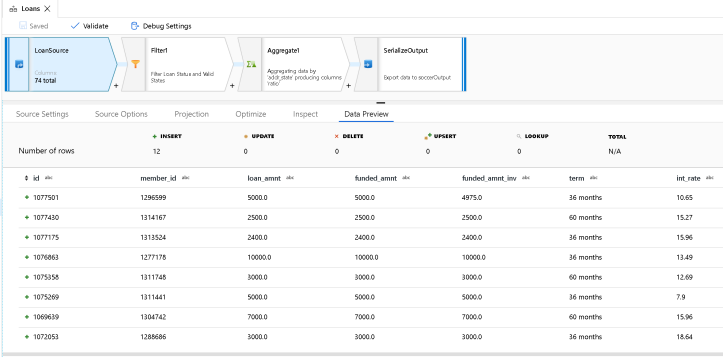
Steps 1 & 2: Load the CSV & map columns
Add a new Source transformation (called LoanSource above) which uses a Delimited Text dataset. The file is the public Lending Tree loans CSV. Enter “,” as the delimiter and since the file has a header row, all columns will be named appropriately and defaulted to String data types. You can set the data types in the Projection tab or ask ADF to try and auto-detect the types for you. For this sample, I only need to change “annual_inc” to decimal so that I can use it with the count() function later.
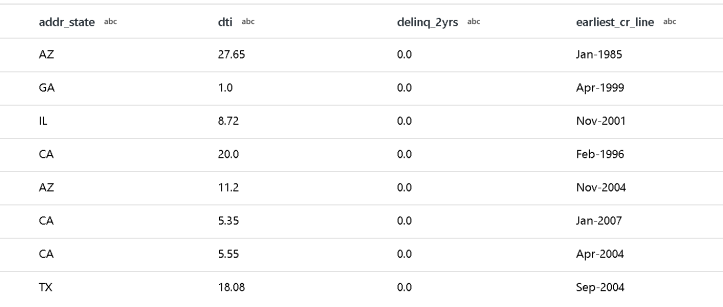
Step 3: Filter for loan status & proper states
In the Databricks Notebook loan sample, the loan statuses of Default, Charged Off and Fully Paid are included and all other types are filtered out. Also, the grouping for the upcoming aggregation is grouped by state in the addr_state column. So in the Filter, I am creating 2 filter conditions. The first one will select only the rows with that loan status. The 2nd filter condition is a common regex to provide some data quality checks in my data flow. This regex will match only rows with a valid 2-letter state abbreviation in the addr_state column:
(loan_status == 'Default' || loan_status == 'Charged Off' || loan_status == 'Fully Paid')
&&
regexMatch(addr_state, '^(?:(A[KLRZ]|C[AOT]|D[CE]|FL|GA|HI|I[ADLN]|K[SY]|LA|M[ADEINOST]|N[CDEHJMVY]|O[HKR]|P[AR]|RI|S[CD]|T[NX]|UT|V[AIT]|W[AIVY]))$')
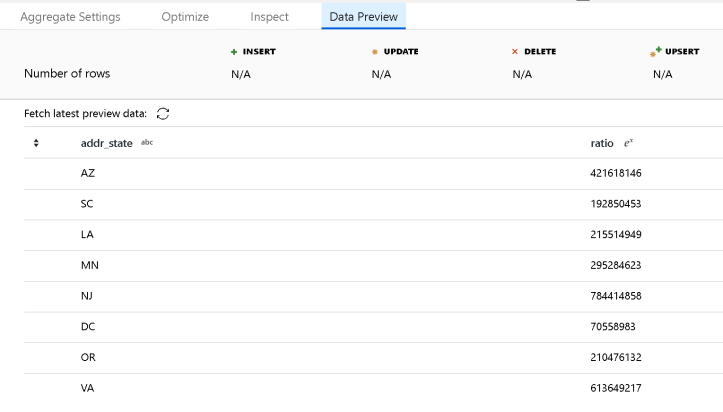
Steps 4 & 5: Group by State and Count Income
I mimic the Databricks Notebook code that is grouping and counting into a single Aggregate transform, producing the results we’re looking for. The Notebook example aliases the result as “ratio” which I did here as well:
That’s pretty much it. I end my Data Flow with a Sink back to a folder in Blob store using the Delimited Text dataset. ADF will read the target folder location in Blob Store and drop the output results in a CSV at that location.
If you’d like a copy of this Data Flow, you can download the JSON here and then import it into your Azure Data Factory.
If you are not already enabled for Mapping Data Flows on your Azure Data Factory, fill out this form and we’ll enable your Azure subscription for this new feature while it is still in preview.

[…] Azure Data Factory: From Databricks Notebook to Data Flow Let’s migrate some transformations to Mapping Data Flow in ADF. […]